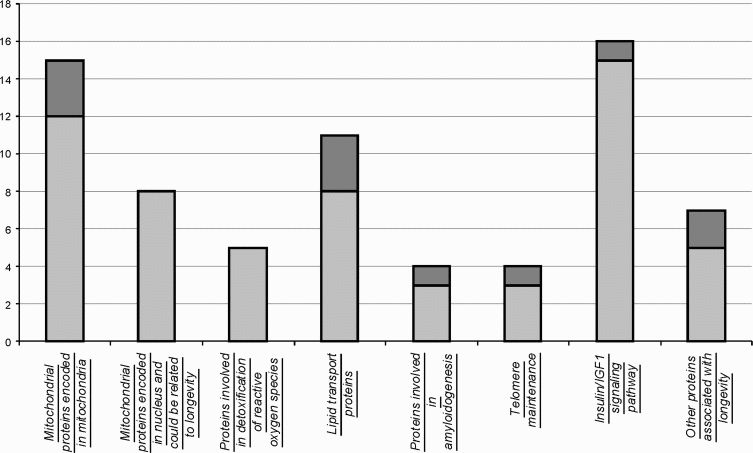
Figure 2.Number of proteins containing aminoacid positions that vary in agreement with longevity. Shown are numbers of analyzed proteins by category (light grey) and those that contained aminoacids that co-vary with longevity (dark grey).
Figure 2 — Genomes of Strongylocentrotus franciscanus and Lytechinus variegatus: are there any genomic explanations for the two order of magnitude difference in the lifespan of sea urchins? | Aging