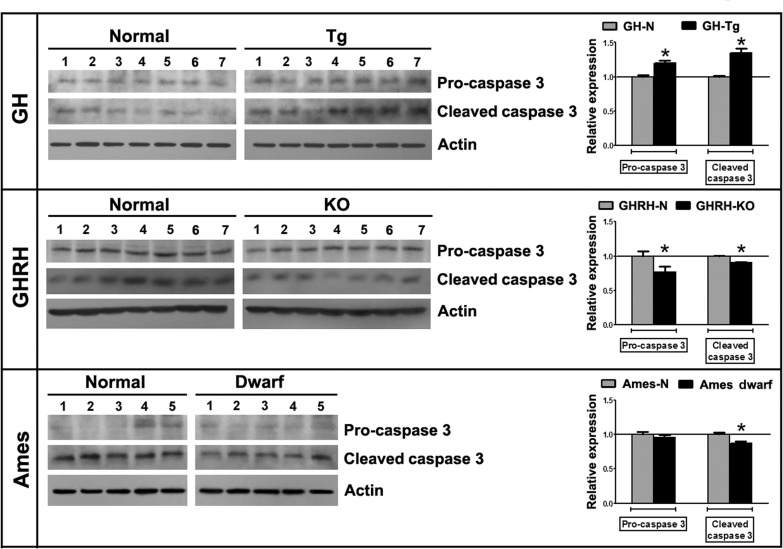
Figure 6.Longevity is inversely associated with testicular apoptosisTesticular expression of pro-caspase 3 (32 kDa) and cleaved caspase 3 (15 kDa) was measured by immunoblotting in testicular homogenates of short-lived (GH-Tg) and long-lived (GHRH-KO and Ames dwarf) mice and their normal littermates. Bar plot graphs represent the mean ± S.E.M. and depict the quantification by densitometry of the bands. Results were normalized to actin (42 kDa) and expressed as fold change relative to the control (normal littermates), which was assigned a value of 1. Bar plot graphs represent the mean + SEM; n = 5-7. * p < 0.05, t-Student test.