Submit an Article
Navigate
Home
Editorial Board
Editorial Policies
Current Volume
Archive
Scientific Integrity
Publication Ethics Statements
Interviews with Outstanding Authors
Newsroom
Sponsored Conferences
Podcast
Contact
Special Collections
Submit an Article
Online ISSN: 1945-4589
Research Paper
|
Volume 7, Issue 12
|
pp. 1171–1182
DNA repair in species with extreme lifespan differences
Back to article
Figure 1
(1 of 5)
−
100%
+
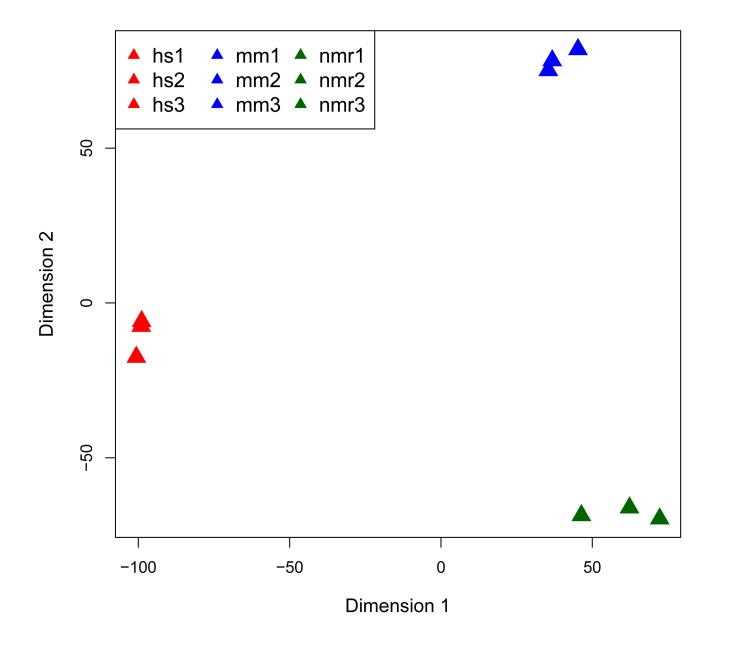
Figure 1.
Multi-dimensional scaling (MDS) plot of RNA-seq datasets
MDS plot of the 500 highest expressed genes shows that each of the three species clusters together in first two dimensions.