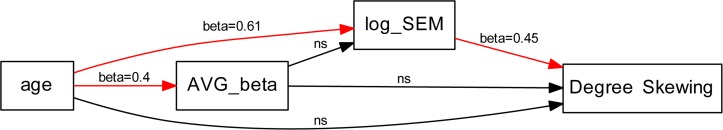
Figure 4.Path diagram with associated path coefficients (β)Arrows indicate the interrelationships tested in the analysis: red arrows indicate significant relationships (p value < 0.05), black arrows indicate non-significant relationships AVG beta = average DNA methylation β values.