Submit an Article
Navigate
Home
Editorial Board
Editorial Policies
Current Volume
Archive
Scientific Integrity
Publication Ethics Statements
Interviews with Outstanding Authors
Newsroom
Sponsored Conferences
Podcast
Contact
Special Collections
Submit an Article
Online ISSN: 1945-4589
Research Paper
|
Volume 7, Issue 8
|
pp. 568–578
Stochastic epigenetic mutations (DNA methylation) increase exponentially in human aging and correlate with X chromosome inactivation skewing in females
Back to article
Figure 2
(2 of 4)
−
100%
+
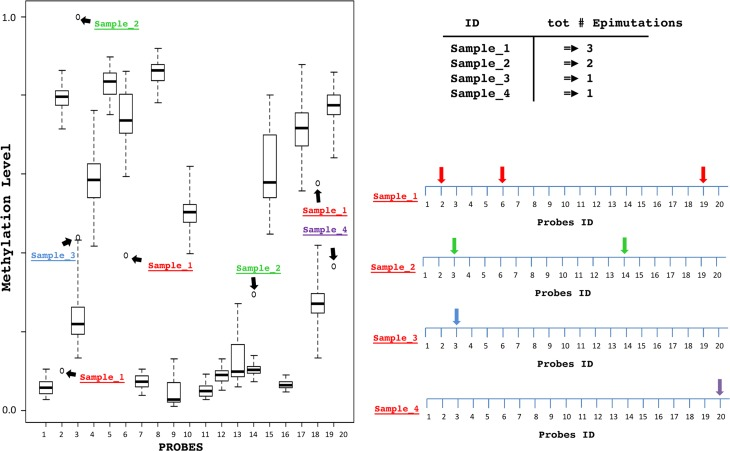
Figure 2.
Schematic description of the SEM
For each probe, a Box-and-whiskers plot analysis identifies extreme outliers samples. For each sample epimutations are detected, counted and mapped considering their genomic position.