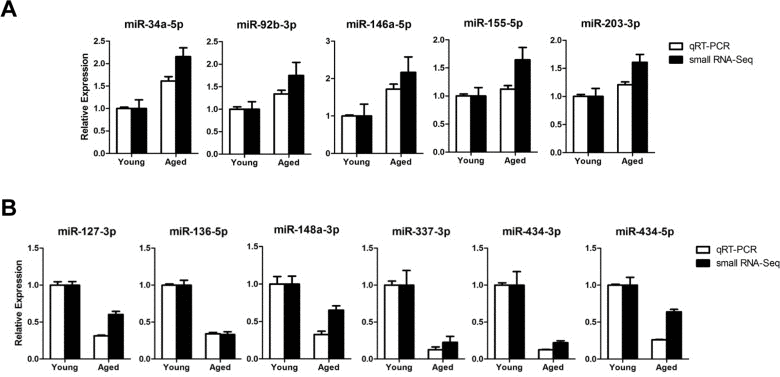
Figure 2.Expression confirmation of 11 representative miRNAs by qRT-PCR(A-B) Relative expressions of miRNAs were determined by TaqMan qRT-PCR (white bar, n = 4 for each group) or small RNA-sequencing (black bar, n = 6 for each group) of the gastrocnemius muscle. The qRT-PCR results were normalized by the average of the U6 snRNA and relative expression level of aged muscles compared to that of young muscles was shown. Error bars indicate SEM.