Submit an Article
Navigate
Home
Editorial Board
Editorial Policies
Current Volume
Archive
Scientific Integrity
Publication Ethics Statements
Interviews with Outstanding Authors
Newsroom
Sponsored Conferences
Podcast
Contact
Special Collections
Submit an Article
Online ISSN: 1945-4589
Research Paper
|
Volume 6, Issue 6
|
pp. 454–467
Transmission from centenarians to their offspring of mtDNA heteroplasmy revealed by ultra-deep sequencing
Back to article
Figure 2
(2 of 6)
−
100%
+
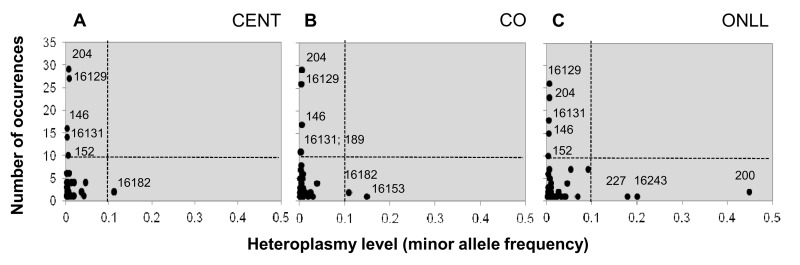
Figure 2.
Heteroplasmic positions in the 3 groups
Heteroplasmic positions plotted according to mean heteroplasmy level and number of occurrences in CENT (
A
), CO (
B
) and ONLL (
C
) respectively.