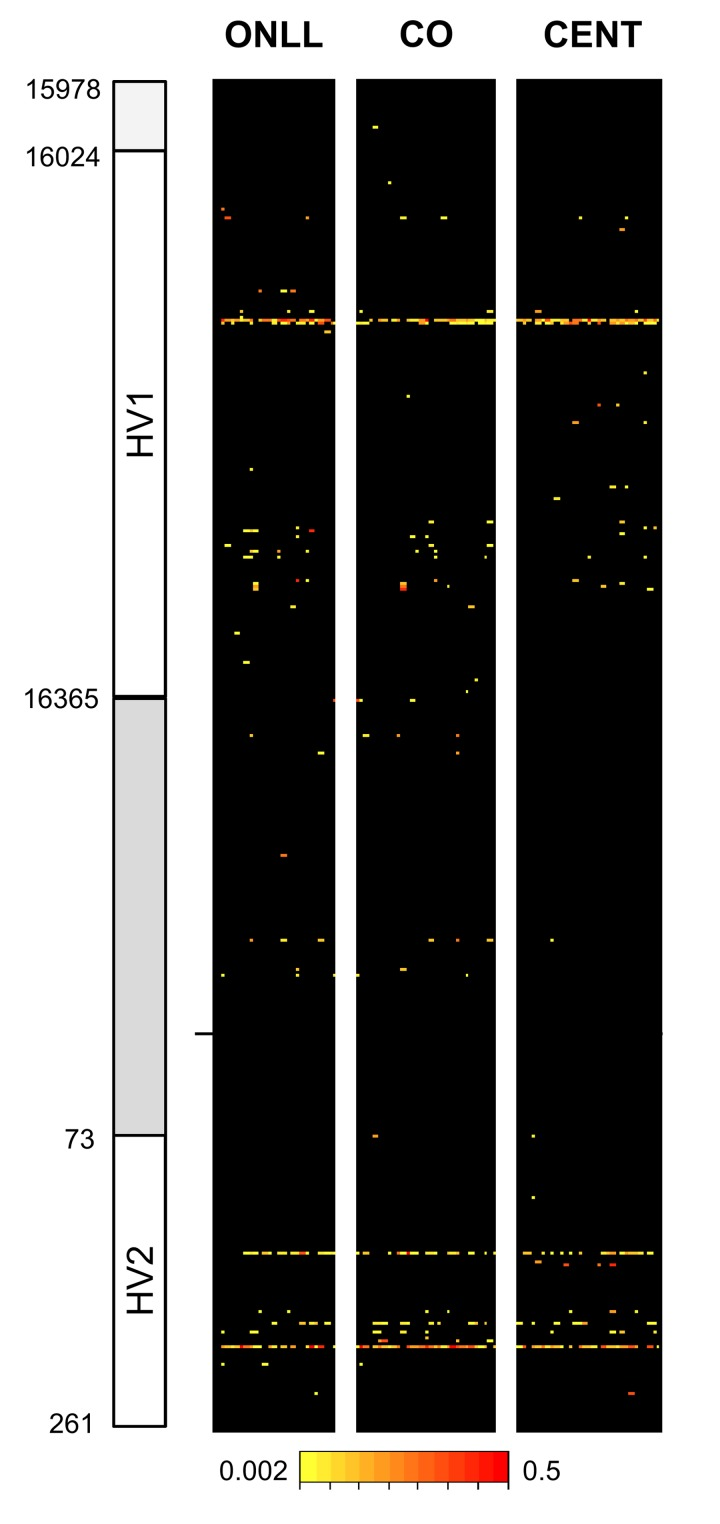
Figure 1.Overview of heteroplasmy pattern in the 853 bp region consideredHeteroplasmic positions are indicated with different colors according to the level of heteroplasmy. Positions are reported on the y-axis while individuals are reported on the x axis.