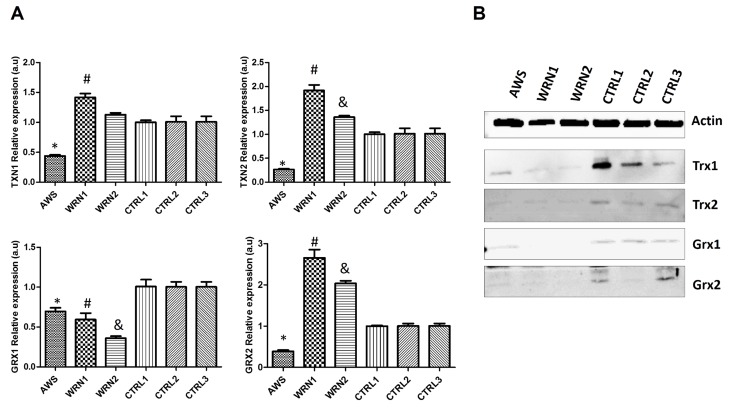
Figure 6.Analysis of the Trx and Grx family proteins in atypical Werner syndrome and Werner syndrome fibroblasts(A) Mean (±SD) mRNA levels of TXN1, TXN2, GRX1, and GRX2 genes determined by qRT-PCR by triplicate. (B) Western blot analysis of the levels of Trx1, Trx2, and Trx3 antioxidant enzymes in fibroblasts from AWS, WS, and controls.