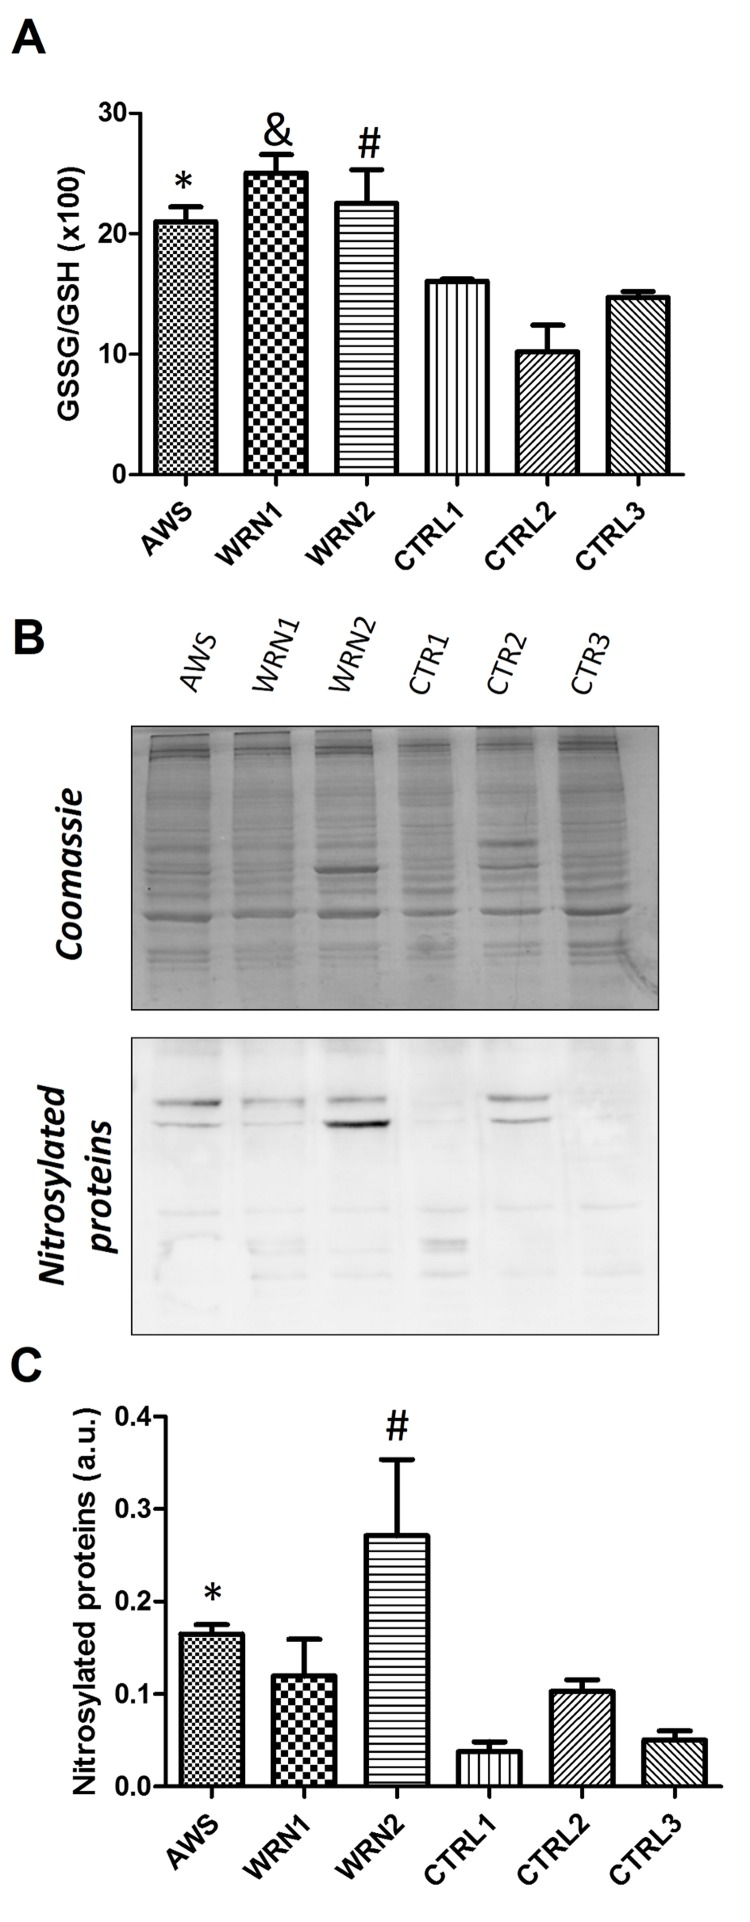
Figure 2.Analysis of the GSH antioxidant levels and Nitro-Tyr levels in atypical Werner syndrome and Werner syndrome fibroblasts(A) The GSSG/GSH ratio measured by triplicates. (B) Immunoblot of proteins from total extracts of AWS, WS, and control cells. (C) Densitometry of bands normalized by total protein amount using ImagJ software.