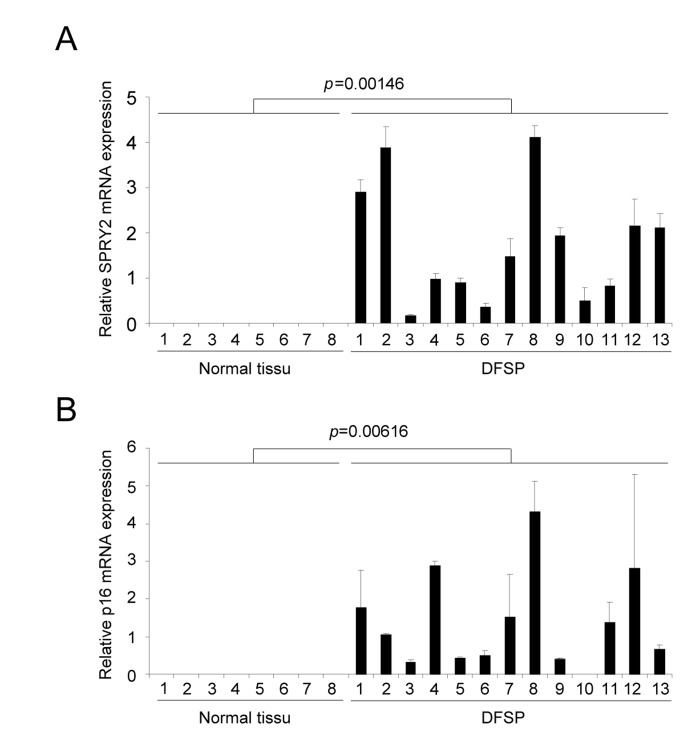
Figure 4.DFSP displays accumulation of senescence markersRNAs were prepared from normal skin or from DFSP samples. They were next reverse-transcribed and qPCR were performed against (A) SPRY2 and (B) p16 and the results were normalized against actin. P value was calculated using a t-test.