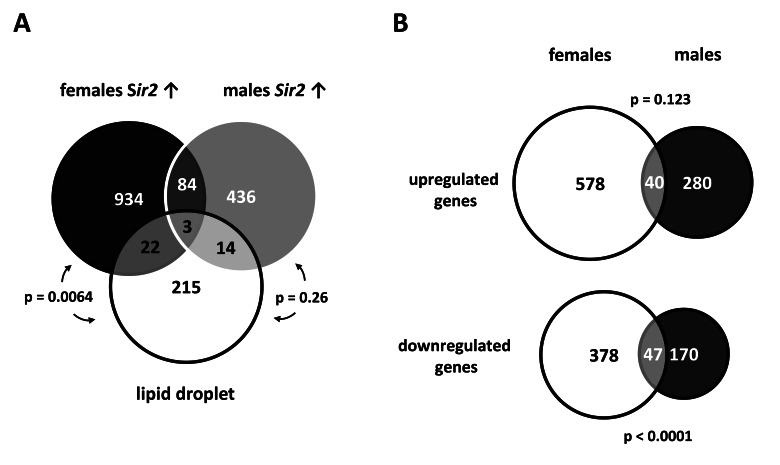
Figure 3.Gene expression profiles of fat bodies overexpressing Sir2 show notable intersections with the lipid droplet proteome(A) Differentially regulated genes (up-and down-regulated) found in Sir2 overexpressing males and females were compared with the lipid droplet proteome as defined by Beller et al. [25]. The Venn diagram shows considerable intersections between these different sample types (statistical analyses were performed with Fisher's exact test; see Table 2 for a list of intersecting genes). (B) To view gender-specific effects, the transcriptional profiles of fat bodies from UAS-Sir2>S1106-Gal4 males and females after 24 h of Sir2 overexpression were compared. The scaled Venn diagrams depict the actual relationship of the numbers of up- and down-regulated genes of both samples and the number of overlapping genes. Genes which were up- or down-regulated > 1.5 fold in at least 2 of 3 microarrays were included in the diagrams shown in (A) and (B).