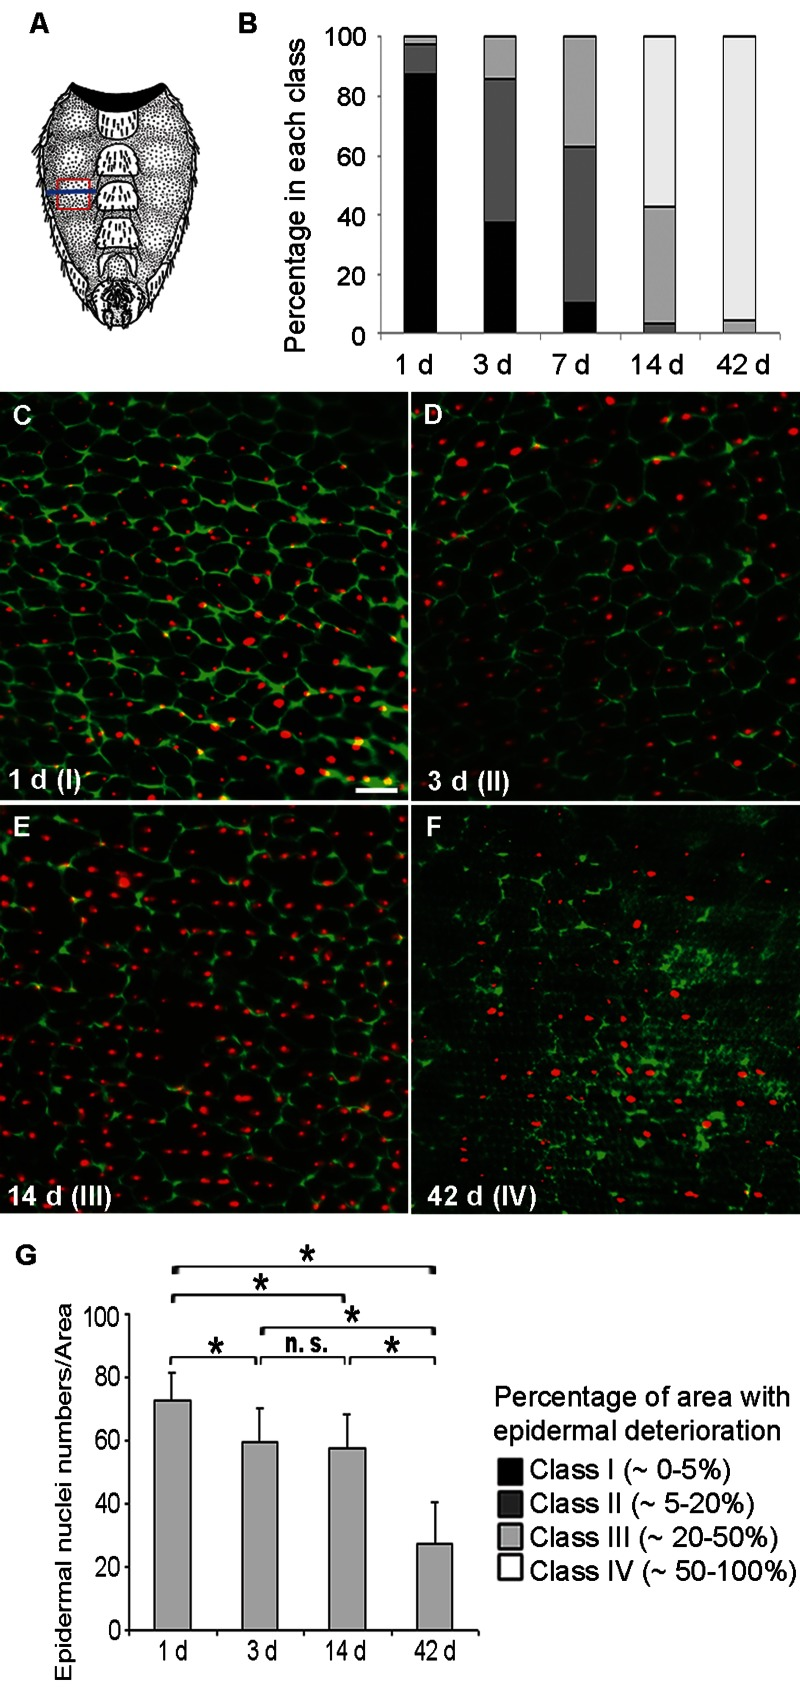
Figure 1.Loss of Membranes and Nuclei in the Aging Adult Epidermis(A) Schematic of the ventral adult abdominal epidermis (reprinted with kind permission by Cold Spring Harbor Laboratory Press from [56]). Red frame, section of the pleura analyzed by immunofluorescence; Blue line, approximate location of TEM cross-sections. (B) Quantification of epidermal deterioration in control w1118 flies with age (n ≥ 10). See C-F for a representative example of each morphology class. (C-F) Control (w;UAS-DsRed2-Nuc2/CyO; NP2108-GAL4/TM6C) epidermal whole mounts of different ages expressing nuclear DsRed2-Nuc (red) and labeled with anti-Fasciclin III (green). Bar, 20 μm. C, 1 d. D, 3 d. E, 14 d. F, 42 d. Green channel intensity elevated in F for visualization of weakly-labeled membranes. All comparisons between different time points were significantly different using the Chi square test (p < 0.05). (G) Quantification of nuclear numbers in epidermal whole mounts of flies of different ages bearing NP2108-GAL4 and UAS-DsRed2-Nuc (n = 7 for 1 d and 14 d; n = 8 for 3 d and n = 3 for 42 d). Asterisks, significant comparisons by Single-Factor Anova (p < 0.05); n. s., not significant.
Figure 1 — Autophagy drives epidermal deterioration in a Drosophila model of tissue aging | Aging