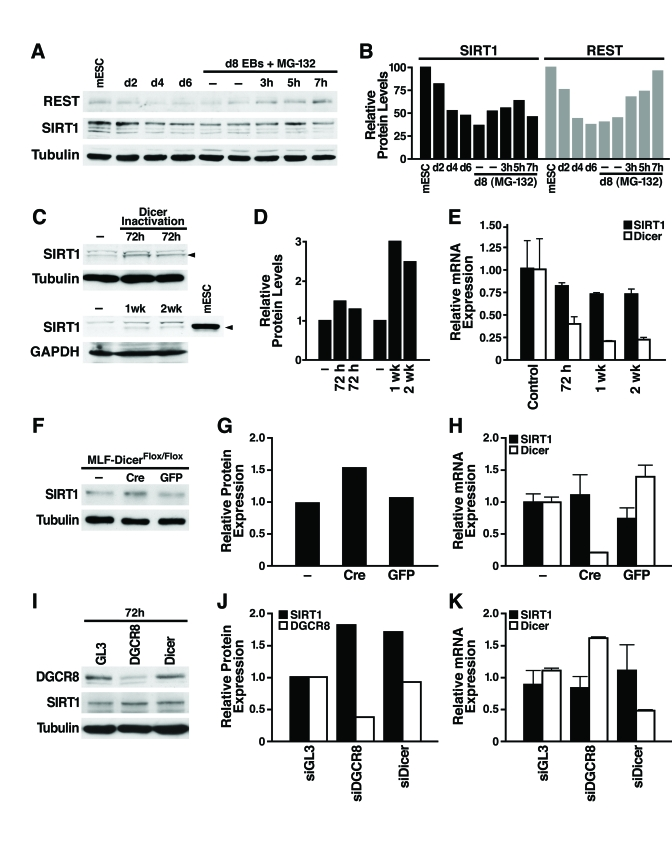
Figure 2.miRNAs post-transcriptionally regulate SIRT1. (A)
mESCs were differentiated and treated on d8 with the proteasome inhibitor
MG-132 (10 μM, 3-7 h), and
protein lysates were analyzed on western blots. Data are representative of
four experiments. (B) Protein levels of SIRT1 and REST relative to tubulin levels were quantified by densitometry
with NIH Image. (C-E) The
consequences of Dicer inactivation and loss of small RNAs were assessed in
protein lysates and RNA from livers of control and Dicerflox/flox
mice injected with the AAV8 vector expressing cre at the indicated times. (C)
Western blotting was used to analyze 70 μg
of liver lysate and 10 μg of mESC
lysate. (D) SIRT1 protein levels relative to tubulin or GAPDH were
quantified by densitometry. (E) SIRT1 and Dicer mRNA levels were measured
by qRT-PCR. Data are mean ± s.d. for four samples. (F-H) Lung
fibroblasts were cultured from DicerFlox/Flox mice and infected
with adenoviral Cre or GFP. (F) SIRT1 protein levels were measured
by western blotting 72 h after Cre inactivation of Dicer. (G) SIRT1
protein levels relative to tubulin were quantified by densitometry. (H)
mRNA levels of SIRT1 and Dicer were measured by qRT-PCR. Data are mean ±
s.d. for three samples. (I-K) siRNAs were transfected into NIH3T3
cells to knockdown DGCR8, Dicer, or GL3 luciferase as a control. (I)
DGCR8 knockdown and increased SIRT1 protein levels were analyzed by western
blotting 72 h after siRNA transfection. Data are representative of three
experiments. (G) qRT-PCR analysis confirmed Dicer knockdown and no
significant change in SIRT1 mRNA levels. Data are mean ± s.d. for three
samples.