Submit an Article
Navigate
Home
Editorial Board
Editorial Policies
Current Volume
Archive
Scientific Integrity
Publication Ethics Statements
Interviews with Outstanding Authors
Newsroom
Sponsored Conferences
Podcast
Contact
Special Collections
Submit an Article
Online ISSN: 1945-4589
Priority Research Paper
|
Volume 1, Issue 11
|
pp. 903–936
Drosophila melanogaster p53
has developmental stage-specific and sex-specific effects on adult life span indicative of sexual antagonistic pleiotropy
Back to article
Figure 3
(3 of 4)
−
100%
+
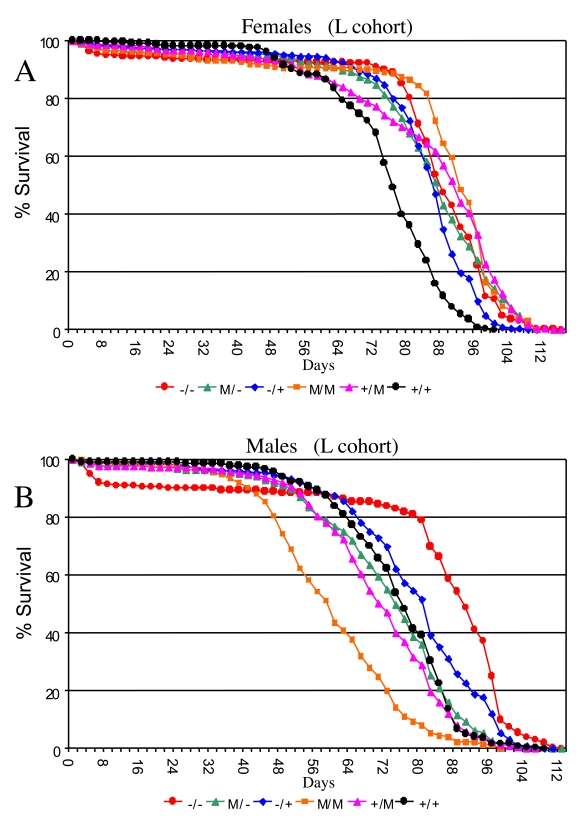
Figure 3.
Effect of p53 mutations on life span.
Cumulative survival curves for L cohort. A key of p53 genotypes is presented below the graphs. Males are indicated with solid symbols and females are indicated with open symbols. (
A
) Females. (
B
) Males.