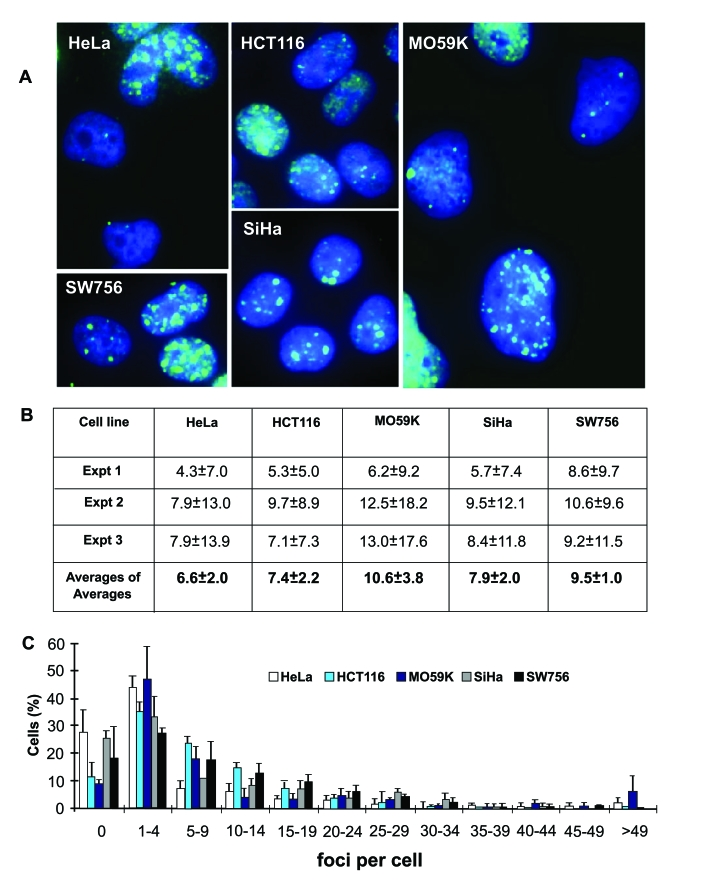
Figure 2.Endogenous γ-H2AX foci in interphase cells of five human tumor cell lines.(A) Images of endogenous γ-H2AX foci (green) in untreated HeLa, HCT116,
M059K, SiHa and SW756 cells. DAPI staining (blue) indicates DNA. (B)
Average numbers of γ-H2AX foci per cell in three
independent experiments (Expt 1-3) with high SDs (n is at least 70 cells
counted in each experiment), and average of averages from these experiments
(n=3). (C) Fractions of cells in the five tumor cell populations
with the noted numbers of γ-H2AX
foci.